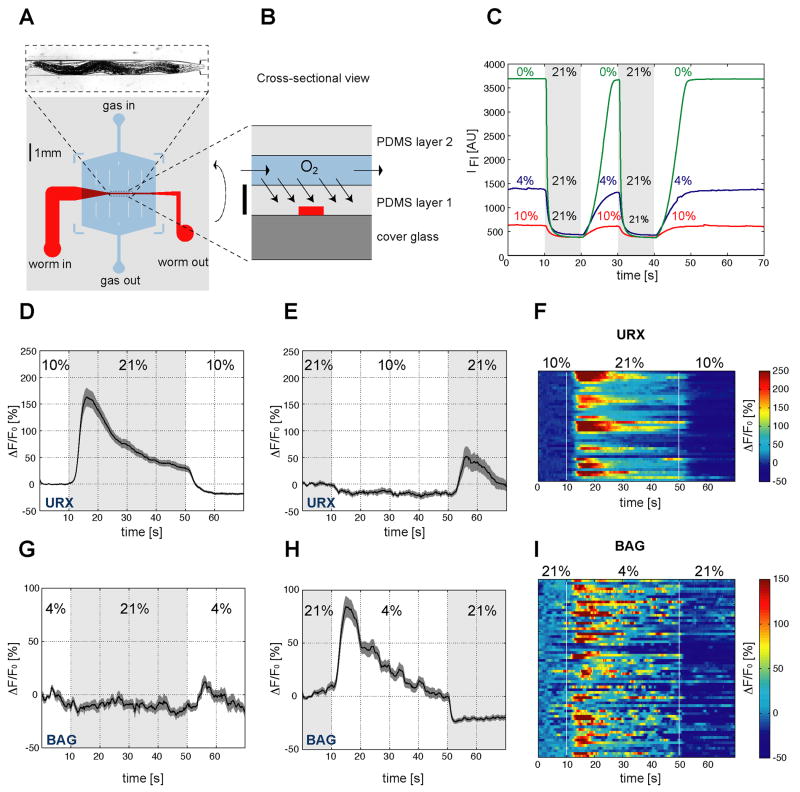
Figure 2. BAG and URX neurons sense O2.
(A,B) Device used to immobilize C. elegans for calcium imaging. (A) Layout of the microfluidic worm channel (red) and the overlying O2 flow chamber (blue). The surrounding grey shaded box represents PDMS cast. Image at top shows an animal in the channel. (B) Schematic cross section of the device. Scale bar represents 100 μm. (C) Fluorescence imaging of the O2-sensitive dye Ru(phen)3Cl2 dissolved in the worm channel. Each trace is a fluorescence intensity profile recorded while switching between the indicated O2 concentrations. (D–I) Measurements of neural activity by calcium imaging of URX and BAG. (D,E,G,H) Black traces show the average percent change of G-CaMP fluorescence (ΔF/F0) and dark shading shows standard error of the mean (SEM). Concentrations were 21% and 10% O2 (D,E) or 21% and 4% O2 (G,H). Light grey shading indicates the intervals at 21% O2. (D) Average URX response to O2 upshift. (E) Average URX response to O2 downshift (a significant decrease is observed following a 21-10% downshift, as compared to a 21-21% control shift (Figure S3) (P=0.0195 by t-test)). (F) Individual URX responses to O2 upshift, n=42. Each row represents one neuron. (G) Average BAG response to O2 upshift. (H) Average BAG response to O2 downshift. (I) Individual BAG responses to O2 downshift, n=67. Each row represents one neuron. Control traces for URX and BAG calcium imaging are shown in Figure S3.

