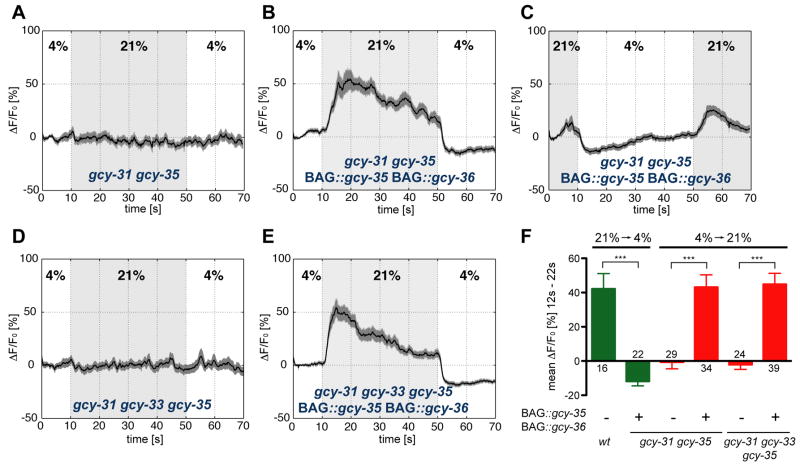
Figure 7. sGCs define neuronal oxygen specificity.
(A–E) Calcium imaging of BAG neurons with altered sGC expression. Black traces show the average percent change of G- CaMP fluorescence (ΔF/F0) and dark shading shows standard error of the mean (SEM). Concentrations were 21% and 4% O2. Light grey shading indicates the intervals at 21% O2. (A,B) Calcium responses of gcy-35(ok769); gcy-31(ok296) (A) and gcy-35(ok769); gcy-31(ok296); BAG::gcy-35 BAG::gcy-36 sGC swap animals (B) to O2 upshift. (C) Calcium responses of gcy-35(ok769); gcy-31(ok296); BAG::gcy-35 BAG::gcy-36 sGC swap animals to O2 downshift. (D,E) Calcium responses of gcy-35(ok769); gcy-33(ok232); gcy-31(ok296) (D) and gcy-35(ok769); gcy-33(ok232); gcy-31(ok296); BAG::gcy-35 BAG::gcy-36 sGC swap animals (E) to O2 upshift. (F) Average ΔF/F0 (12–22 s) of animals with indicated genotypes. Error bars indicate SEM. Asterisks indicate significance by t-test (***P<0.0001). The numbers of recordings analyzed are indicated.

