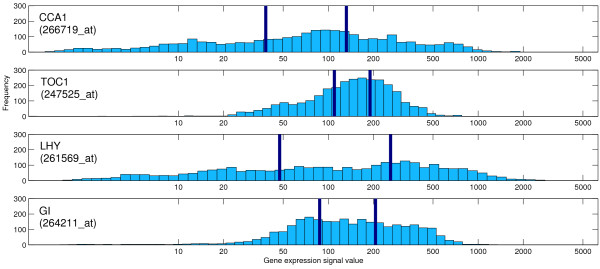
Figure 2.
Gene expression histograms. Gene expression histograms for the four probes detecting the RNA transcripts of the four clock genes in Figure 3(a). The plot shows the gene expression signal value (on a log10 scale) versus frequency from the 2904 examples. The different class thresholds are highlighted in dark blue for each gene, splitting each gene's signal values in to three equally sized classes.

