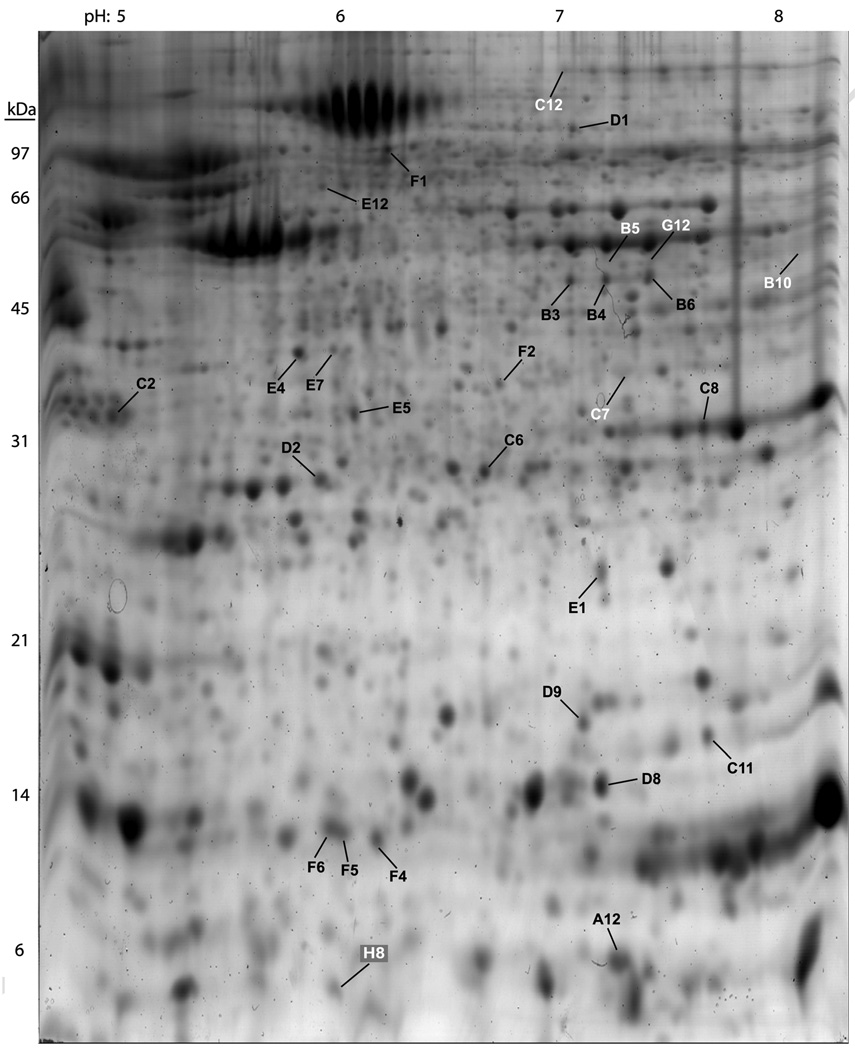
Fig. 3.
[69]. Two-dimensional gel of diabetic mouse skin. This SYPRO Orange stained gel contains proteins separated from the skin of diabetic mice at 19 week of age following 16 weeks on a high-fat diet. The gel was imaged using a VersaDoc 1000 Imaging System. The approximate pI and molecular weights are labeled along the top and left hand borders of the gel, respectively. Spot detection and densitometry were performed using the Discovery Series PDQuest 2-DE analysis software package version 7.0 that accompanied the VersaDoc 1000 Imaging System. Spots labeled with black letters and numbers represent proteins that were increased in the diabetic state while spots labeled with white letters and numbers represent proteins that were decreased in the diabetic state as compared to control skin samples. All labeled spots were removed from the polyacrylamide gel and analyzed by both MALDI-TOF and MS/MS mass spectrometry at the Michigan Proteome Consortium. Copyright Wiley-VCH Verlag GmbH & Co.KGaA. Reproduced with permission.

