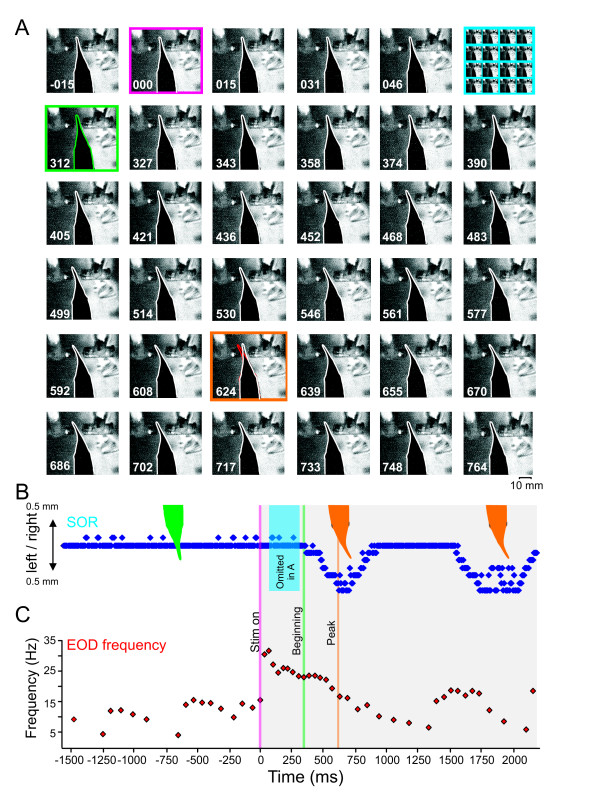
Figure 2.
Movement of the Schnauzenorgan. A. Sequence of the SOR filmed at 128 frames/s ordered from left to right and top to bottom. Every second frame is shown, resulting in a timeline of 15.6 ms from frame to frame. Numbers in each frame give the time in ms with respect to stimulus onset. The dipole-object's resistance was changed during the 2nd frame of the first row. The beginning of the SOR is highlighted by the green square (first frame in the second row). The peak displacement of the SO is indicated by the orange frame. Note that for the sake of clarity, eighteen frames between the stimulus and the initial SOR have been omitted (see top hand corner in A and blue box in B). B. Tracking data of the Schnauzenorgan's displacement. C. Instantaneous EOD-frequency as measured during the sequence shown in A and B. Note that the SOR peaks about 400 ms after the novelty response. Time of stimulation, first and maximal SOR are indicated in B and C by the three vertical lines.

