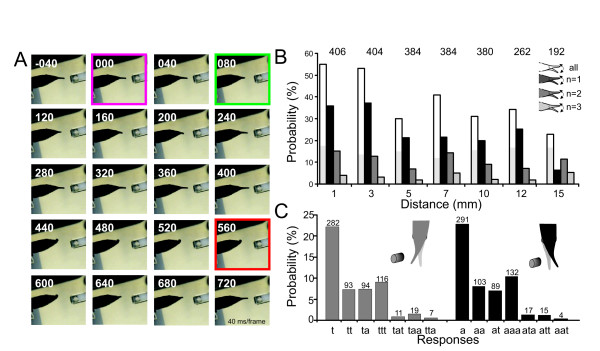
Figure 3.
Probability of the SOR. A. Example of the Schnauzenorgan response evoked at the tip of the Schnauzenorgan. The change in resistivity occurred in the second frame (frame-rate 40 ms/frame, timeline in individual frames is given with respect to stimulus onset). First movement (green) and max SOR (orange) are indicated. B. Bar plot of the probability of the occurrence of a Schnauzenorgan response with the object placed at different distances from the skin pooled for all dipole-positions. Only responses that consisted of one (black), two (medium grey) or three full movements (light grey) are shown. White bars show the absolute probability of a response. The light grey area within the white columns represents the probability of a Schnauzenorgan response evoked by a control stimulus (no change in object resistance). This measure served as a reference for the spontaneous level of Schnauzenorgan responses. Data were pooled for on- and off-stimuli. C. Probability of 14 different types of movement observed during an SOR. Light grey columns correspond to movements starting with a movement towards the object, while black columns show those responses where the Schnauzenorgan initially was moved away from the object. The direction of consecutive movements is given by the letters below the bars (a = away, t = towards). Numbers above graphs in B and C give the absolute number of stimuli the data are based upon.

