Figure 9.
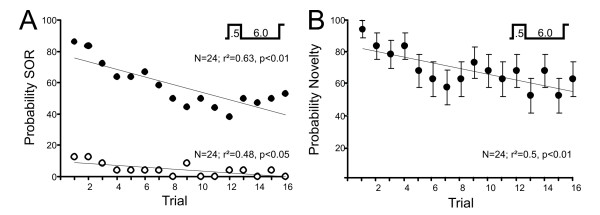
Habituation of the SOR. A. Probability of evoking the SOR in a series of 16 consecutive trials (inter-trial interval 6 s, see inset). The filled circles show the data for on responses, while off responses are shown as open circles. Note that stimuli were much shorter than those used for the general description of the SOR, which is reflected in the absence of "off" responses. B. Mean amplitude of the novelty response as a function of the number of trials for the data shown in A. In A and B, responses were evoked by a switch that lasted 0.5 s, which was sufficiently short to evoke only a single novelty response and mainly on-responses of SORs. Error bars in B are S.E.M.

