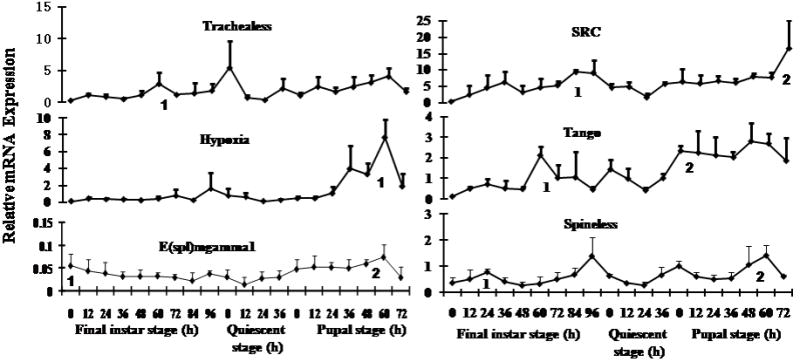
Fig. 5.

Expression profiles of six bHLH PAS and HES family genes in the whole body of T. castaneum determined by quantitative real-time PCR (qRT-PCR). Samples were collected at 12 h interval during the final instar and pupal stages. Total RNA was extracted from pools of three larvae for each treatment. The mRNA levels were normalized using the levels of rp49 as an internal control. Mean+SD of two independent experiments with three replicates each are shown. Statistical analysis was performed as described in the Materials and methods section and peaks of expression are marked with numbers.
