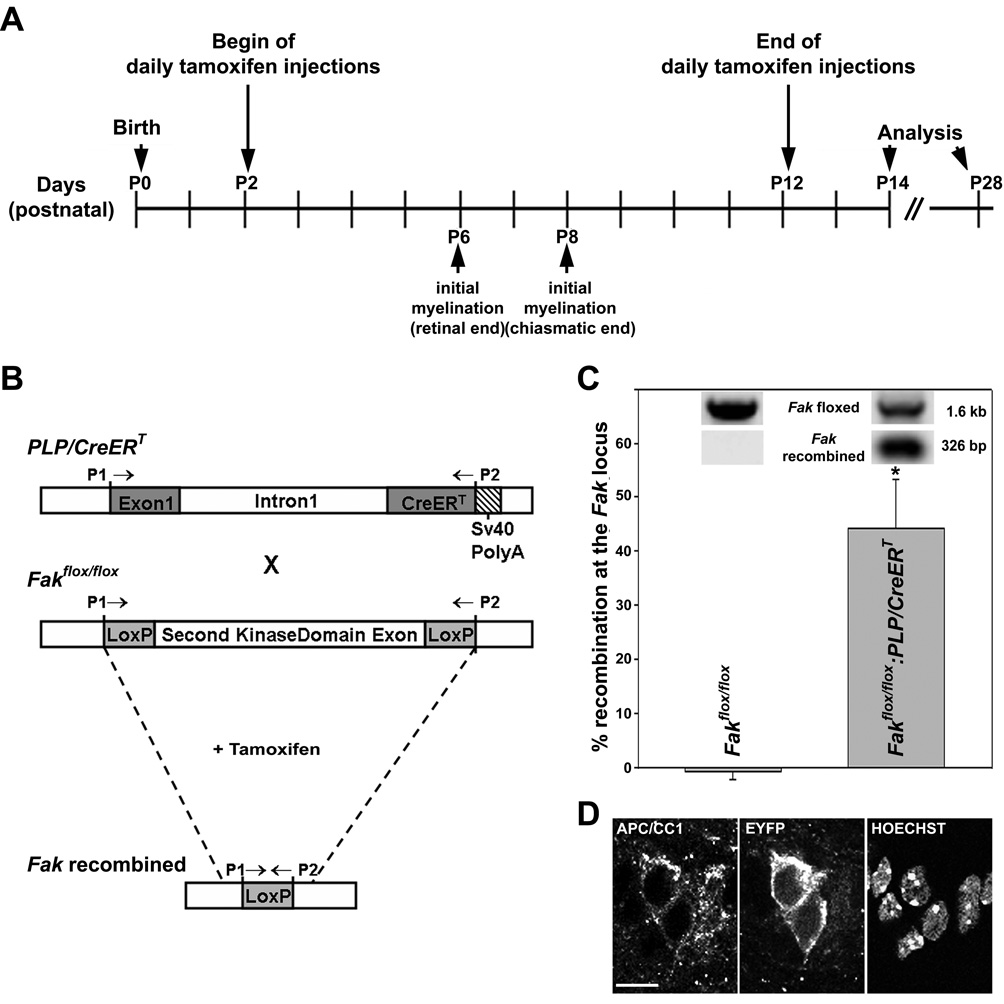
Figure 1.
Induction of Cre-mediated recombination in Fakflox/flox:PLP-CreERT and Gt(ROSA)26Sortm1(EYFP)Cos:PLP-CreERT mice A: Injection paradigm used to induce Cre-mediated recombination at the floxed fak or ROSA26 locus just prior to and during myelination of the optic nerve. Time points of initial myelination are defined as described by Thomson et al. (2005). B: The schematic at the top depicts the transgene construct used to generate the PLP/CreERT mice (Doerflinger et al., 2003). The PLP cassette contains 2.4 kb of the 5’-flanking DNA, exon 1 and intron 1 of the Plp gene. The cDNA sequence coding for CreERT was inserted 3’ of intron 1. For transcription termination a simian virus (SV) 40 poly(A) signal sequence was added. The middle schematic depicts the floxed Fak locus, in which the second kinase domain exon of Fak is flanked by loxP sites (Beggs et al., 2003). Upon cross breeding and tamoxifen application, recombination at the Fak locus is induced as depicted in the bottom schematic. P1 and P2 indicate the location of PCR primers used for genotyping. C: PCR analysis of recombination at the Fak locus in optic nerves of tamoxifen-treated Fakflox/flox:PLP-CreERT and Fakflox/flox mice at P14. Primers P1 and P2 depicted in A were used and the amount of each amplification product was determined using the VersaDoc 4000 imaging system (Bio-Rad, Hercules, CA). The bar graph depicts means ±SEM (n=3 per genotype). The star indicates statistical significance as determined by Student’s t-test. D: Representative confocal images of P14 optic nerve sections taken from tamoxifen-treated Gt(ROSA)26Sortm1(EYFP)Cos:PLP-CreERT mice after double-labeling for APC/CC1 and YFP. Nuclei were stained using Hoechst. Images depict single channel representations of a single optical section (approximately 0.2 µm x–z resolution). Scale Bar: 10 µm.

