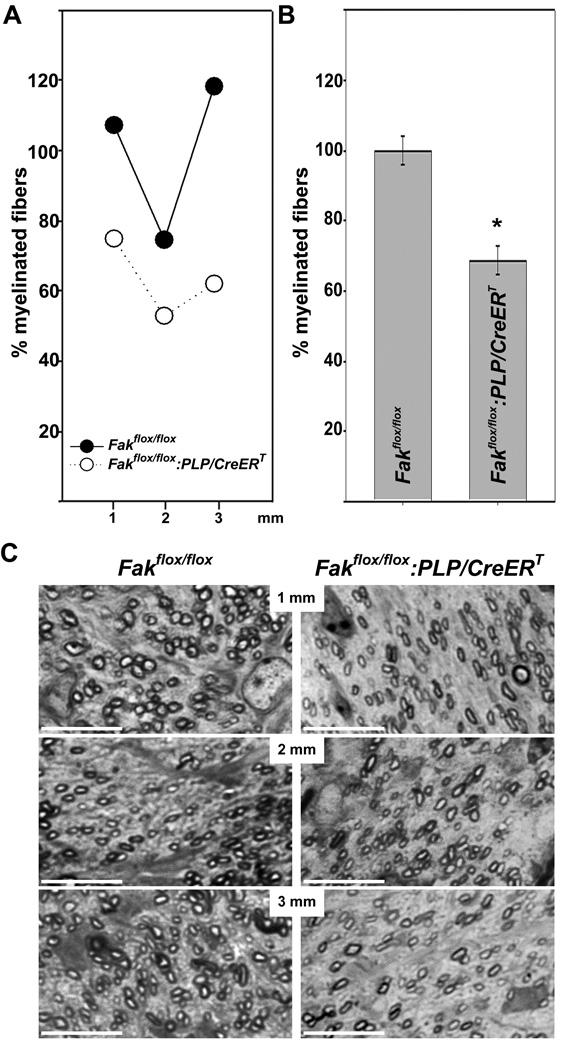
Figure 2.
Reduction of the number of myelinated fibers in the optic nerves of tamoxifen treated Fakflox/flox:PLP/CreERT mice at P14 A: Numbers of myelinated fibers within entire transverse sections of P14 optic nerves at approximately 1, 2 and 3 mm from the lamina cribosa. The mean for all control values was set to 100% and the percent values for all data points were calculated accordingly. The results for a representative optic nerve littermate pair are shown. B: Numbers of myelinated fibers averaged over all three intervals of the optic nerve. The percent values were calculated as described in A. The bar graph depicts means ±SEM (n=3 per genotype). The star indicates statistical significance as determined by Student’s t-test. C: Representative pictures of semithin sections from Fakflox/flox (left panel) and Fakflox/flox:PLPCreERT (right panel) optic nerves taken at approximately 1, 2 and 3 mm from the lamina cribosa. Scale Bar: 10 µm.

