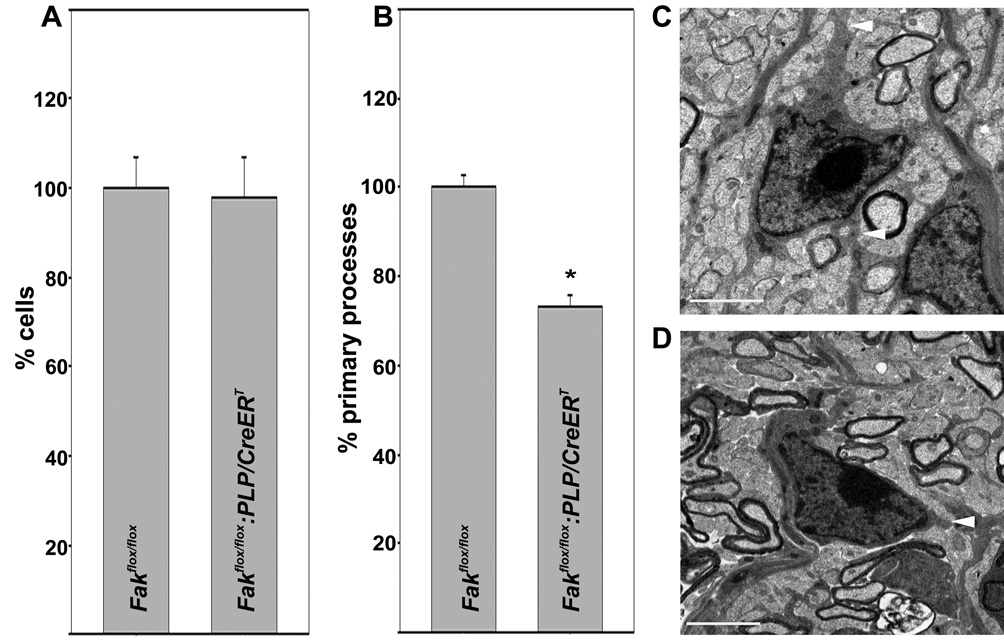
Figure 4.
Reduction of the number of primary oligodendrocyte processes in the optic nerves of tamoxifen treated Fakflox/flox:PLP/CreERT. A: Total number of cells counted at light microscopic level in semithin P14 optic nerve sections at the 1 mm interval (see Fig. 2). The mean for all control values was set to 100 % and the percent values for all data points were calculated accordingly. The bar graph depicts means ±SEM (n=3 per genotype). B: Number of primary processes per cell counted at elecron microscopic level and over an entire transverse section for each nerve analyzed. The mean for all control values was set to 100 % and the percent values for all data points were calculated accordingly. The bar graph depicts means ±SEM (n=3 per genotype; 258 cells for each condition). The star indicates statistical significance as determined by Student’s t-test. C: and D: Representative transmission electron micrographs for a Fakflox/flox:PLP/CreERT (C) and a Fakflox/flox (D, control) oligodendrocyte. Scale Bar: 2 µm.

