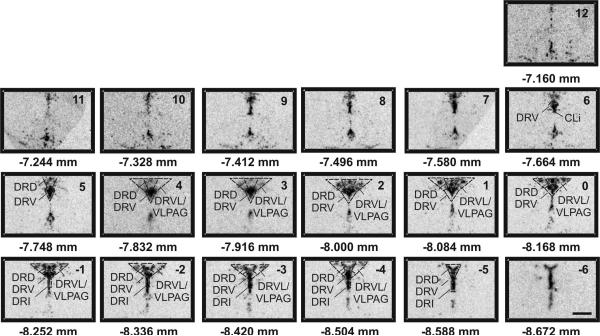
Figure 1.
Atlas of rat tryptophan hydroxylase 2 (tph2) mRNA expression in the midbrain raphe complex (84 μm intervals) used for analysis of subregions of the DR with a high level of neuroanatomical resolution. Photographs are autoradiographic images of tph2 mRNA expression. The levels chosen for analysis ranged from −7.664 mm Bregma (designated Level 6) though −8.588 mm Bregma (designated Level −5). Dotted lines delineate different subdivisions of the dorsal raphe nucleus analyzed in this study, based on a sterotaxic atlas of the rat brain (Paxinos and Watson 1998). Abbreviations; CLi, caudal linear nucleus of the raphe; DRD, dorsal raphe nucleus, dorsal part; DRI, dorsal raphe nucleus, interfascicular part; DRV, dorsal raphe nucleus, ventral part; DRVL, dorsal raphe nucleus, ventrolateral part; VLPAG, ventrolateral periaqueductal gray. Scale bar, 1 mm.

