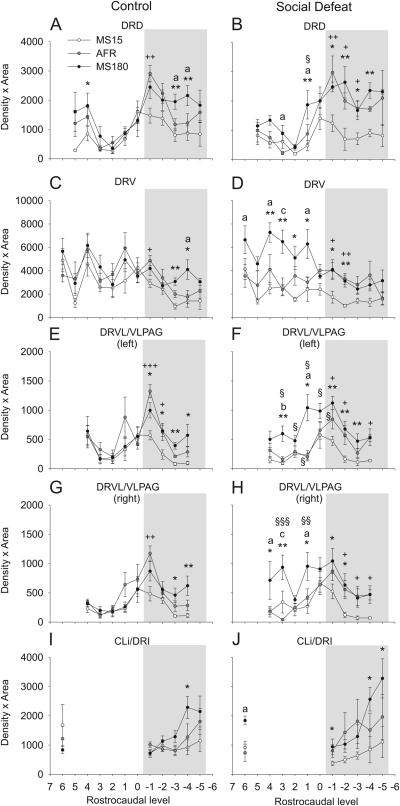
Figure 4.
Effects of social defeat on neuronal tph2 mRNA expression at specific rostrocaudal levels of subdivisions of the DR are dependent on early life experience. Each graph illustrates the mean tph2 mRNA expression levels throughout the rostrocaudal extent of a different subdivision of the DR in MS15, AFR, and MS180 rats exposed to a novel cage (control, left) or social defeat (right) as adults. A) DRD; B) DRV; C) left DRVL/VLPAG; D) right DRVL/VLPAG; E) CLi and DRI. For abbreviations, see Figure 1 legend. +P < 0.05, ++P < 0.01, +++P < 0.001, comparison of MS15 and AFR groups. *P < 0.05, **P < 0.01, comparison of MS15 and MS180 groups. aP < 0.05, bP < 0.01, cP < 0.001, comparison of AFR and MS180 groups. §P < 0.05, §§P < 0.01, §§§P < 0.001, comparison of control and social defeat groups within the same early life experience treatment group at the same rostrocaudal level. Rostrocaudal levels +7 through −6 correspond to those illustrated in Figure 1. Gray shading indicates the caudal part of the DR studied; unshaded area indicates the rostral part.

