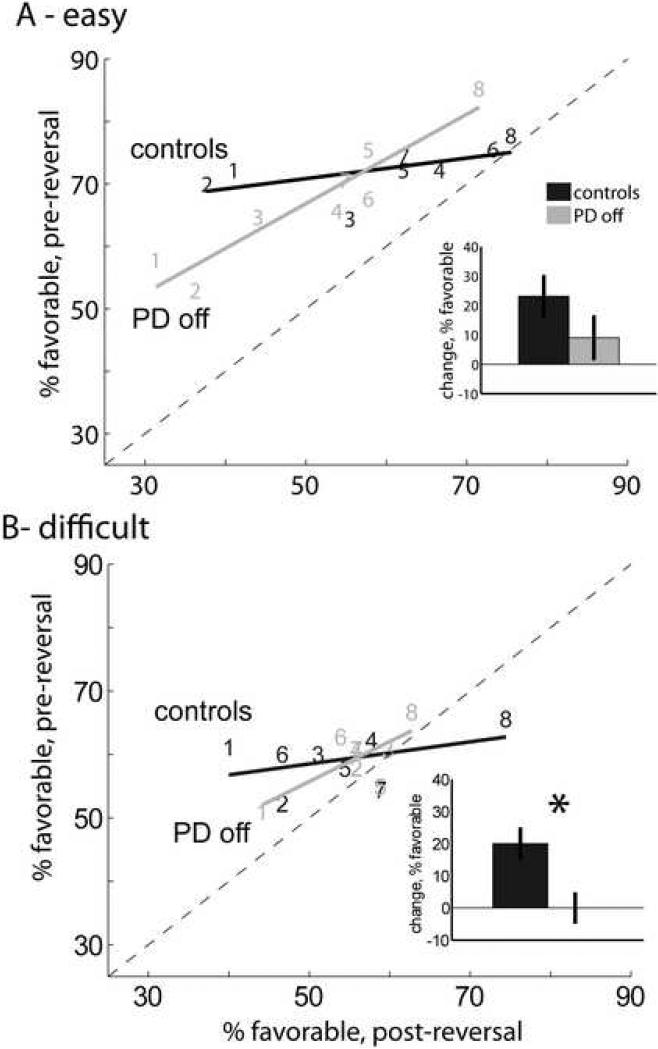
Fig. 3.
Adaptability. Relationship between pre- and post-reversal phase block-by-block learning. Numbers denote block within each 8-block phase. Lines are best linear fits. Dashed line on the diagonal indicates where pre- and post-reversal phase learning are equivalent. (A) easy (“large-difference”) trial pairs only and (B) difficult (“small-difference”) trials pairs only. Insets: mean change in learning from pre- to post-reversal phase. Bars denote standard error, * p < 0.05.

