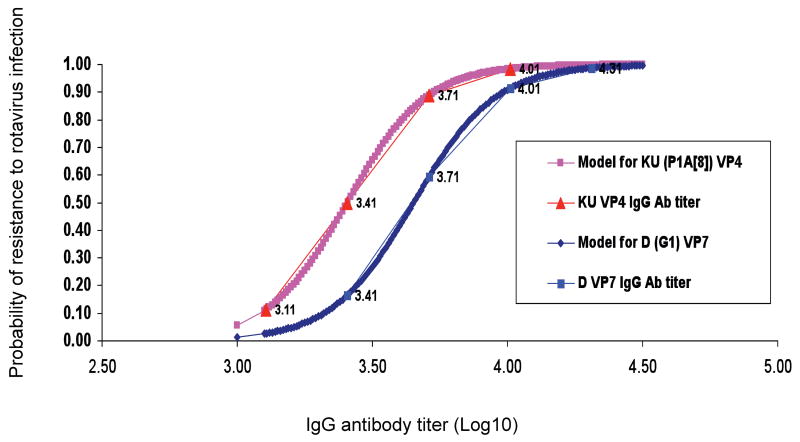
Fig. 4.
Logistic regression model of correlation between serum IgG antibody titers to D (G1) VP7 and KU (P1A[8]) VP4 and resistance to HRV infection. The probability of resistance to rotavirus infection as a function of viral-protein specific antibody titers was modeled using logistic regression. The Wald test p value was equal to 0.05 for both D (G1) VP7 and KU (P1A[8]) VP4 IgG antibody titers. The thick lines show the predicted probability at various levels of IgG antibody; thin lines with labeled x-axis points (the actual log10 IgG geometric mean antibody titers to G1 VP7 or P1A[8] VP4) show the calculated probability of protection against infection using the antibody titers measured in the adults based on the model.
Probability of resistance to HRV infection based on logistic regression model of correlation between pre-challenge serum IgG antibody titers to D (G1) VP7 and KU (P1A[8]) VP4.

