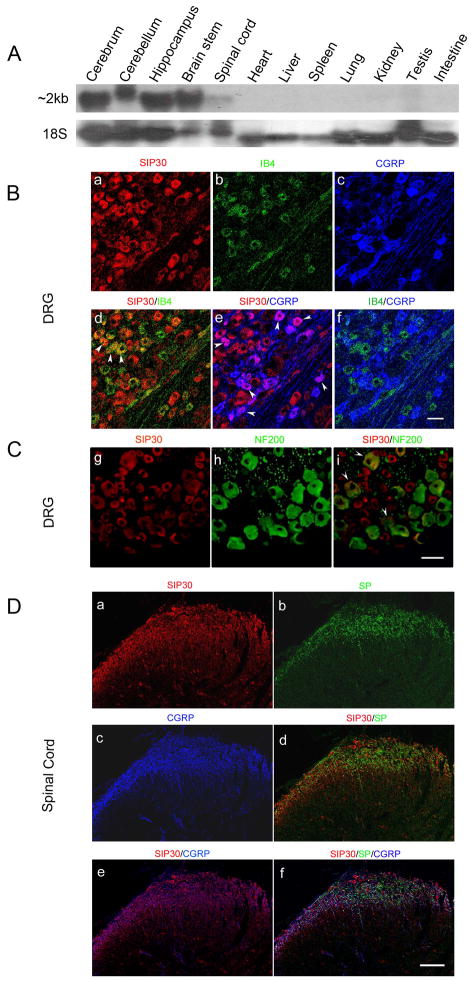
Fig. 1.
Expression pattern of SIP30 in normal rats. Scale bars, 50 μm. A, Northern blot analysis of SIP30 expression in various rat tissues. The 2 kb mRNA band of SIP30 was shown in the upper panel, and 18S ribosomal RNA (lower panel) was used as an internal control for sample loading. Source of tissue for RNA was indicated across the top for each lane. B, SIP30 levels in small-diameter neurons in the DRG. Immunological staining using antibodies against SIP30 (a), IB4 (b), and CGRP (c). Pair-wise superimposed composite images are shown as follows: SIP30 with IB4 (d), SIP30 with CGRP (e), and IB4 with CGRP (f). White arrowheads mark the cells with double staining. C, SIP30 levels in large-diameter neurons in the DRG. Immunological staining using antibodies against SIP30 (g) and NF200 (h). As seen in the merged image (i), only a few large-diameter neurons showed colocalization with SIP30 (white arrowheads mark the cells with double staining). D, SIP30 levels in the spinal cord. Immunological staining using antibodies against SIP30 (a), substance P (b), and CGRP (c). Superimposed composite images are shown as follows: SIP30 with substance P (d), SIP30 with CGRP (e), and triple composite of SIP30 with substance P and CGRP (f).

