
Figure 2.
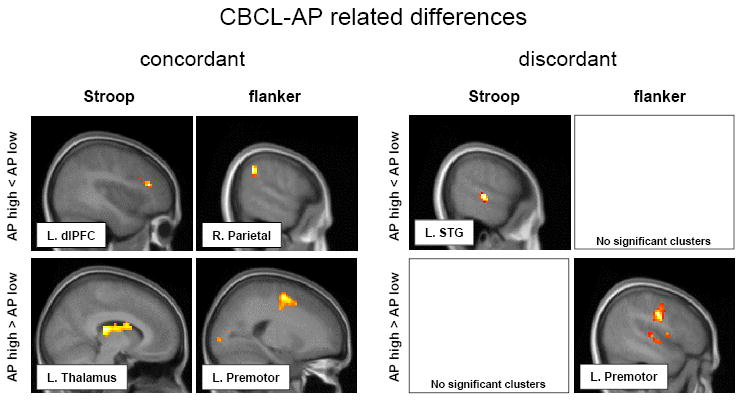
Most significant clusters, overlayed on MR sections, from statistical evaluations of CBCL-AP related differences in brain activation to Stroop and flanker trials with response interference. Left panels: hypoactivations (top row) and hyperactivations (bottom) for concordant high compared to low risk twins (genetic contrast). Right panels: hypo- and hyperactivations activation in discordant high risk twins relative to their low risk co-twins (environmental contrast). For display only, a lower statistical threshold (p < .05; uncorr.) is used. MNI coordinates and Z scores for voxel with maximum effect of each depicted cluster are listed in tables 5 and 6, respectively. dlPFC = dorsolateral prefrontal cortex; STG = superior temporal gyrus.