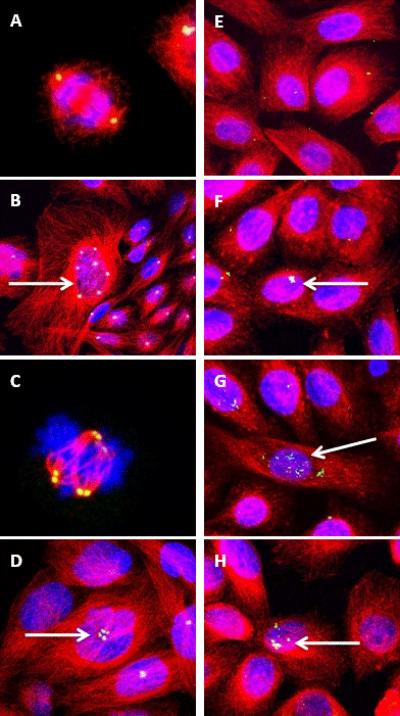
Figure 1. NRTI-exposed CHO and NHMEC M99005 cells visualized by confocal microscopy.
(A–D): CHO cells incubated with an anti-pericentrin antibody + Alexa-Fluor 488 (green), an anti-β-tubulin antibody + Alexa-Fluor 594 (red), and DAPI for visualizing DNA (blue).
(Colocalization of pericentrin and β-tubulin appears yellow and colocalization of pericentrin, β-tubulin, and DAPI appears white.)
(A): Untreated cell with bipolar spindle in anaphase of mitosis.
(B): Cells treated with 122 μM 3TC; arrow shows cell with amplified centrosomes.
(C): CHO cell treated with 89 μM d4T with multi-polar spindles during anaphase of mitosis.
(D): CHO cells treated with 102 μM ddI. Arrow shows centrosome amplification.
(E–H): NHMEC M99005 cells incubated as in A–D. (Colocalization of pericentrin and β-tubulin appears yellow and colocalization of pericentrin, β-tubulin, and DAPI appears white.)
(E): Untreated NHMECs
(F): NHMECs treated with 122 μM 3TC showing centrosome amplification.
(G): NHMECs treated with 89 μM d4T showing centrosome amplification.
(H): NHMECs treated with 102 μM ddI showing centrosome amplification.

