
Fig. 4. 3D-model of the 30S subunit from E. coli indicating the location of each phosphorylated ribosomal protein.
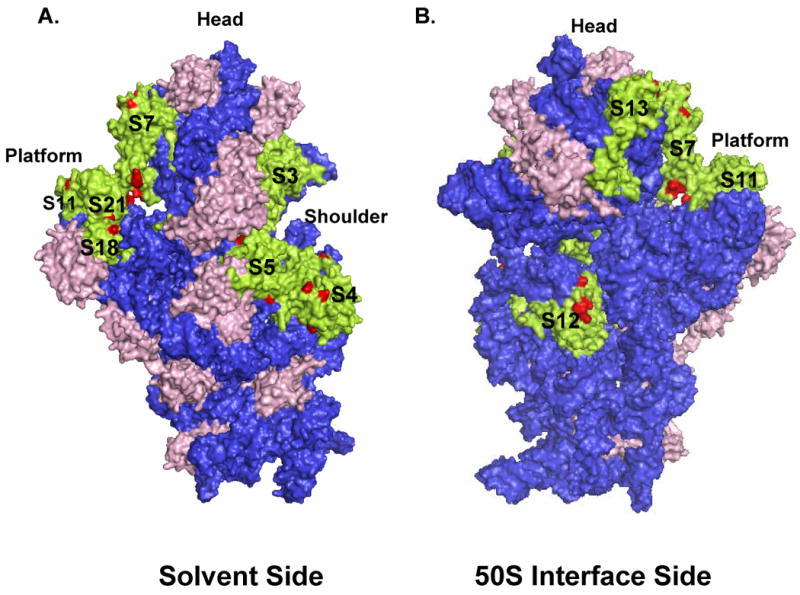
The phosphorylated ribosomal proteins in the 30S subunit are represented by green color, while the phosphorylated residues mapped by mass spectrometry and unphosphorylated proteins are colored red and pink, respectively. Coordinates of the E. coli 30S subunit were obtained from the Protein Data Bank (Acc. # 2AW7). (A) Depicting the 30S subunit from the solvent side, while (B) gives a view of the small subunit from the 50S interface.