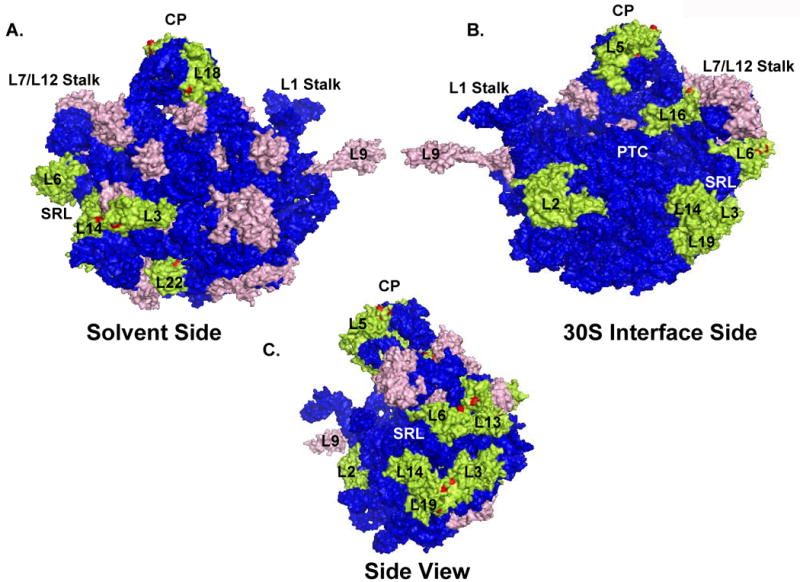
Fig. 6. 3D-model of the E. coli 50S subunit showing the position of each phosphorylated ribosomal protein.

The color coding is the same as in Fig.4. Coordinates of the E. coli 50S subunit were obtained from the Protein Data Bank (Acc. # 2AW4). (A) Depicting the 50S subunit from the solvent side, (B) gives a view of the large subunit from the 30S interface, and (C) is the side view of the large subunit showing the phosphorylated proteins around the SRL. Specific regions, peptidyl transferase center (PTC), central protuberance (CP), sarcin-ricin loop (SRL), L1 and L7/L12 stalks and the 50S ribosomal proteins were labeled in the model generated by PyMol software (DeLano Scientific LLC).
