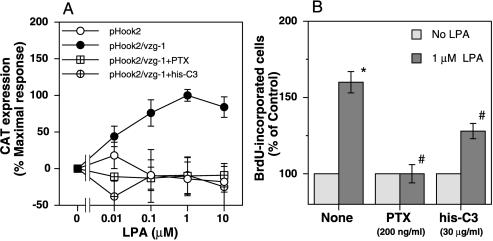
Figure 5.
VZG-1 expression and LPA exposure activate SREs and increase DNA synthesis through both PTX- and C3-sensitive signaling pathways. (A) Effect of PTX or his-C3 exoenzyme on SRE activation by LPA through VZG-1 expression. Stable B103 cells containing CAT driven by c-fos SREs (clone C-1) were transfected transiently with pHook2 or pHook2/vzg-1, treated without or with PTX or his-C3 exoenzyme, and treated with varying LPA concentrations, and SRE activation determined. Basal CAT expression was 229 ± 36 (pHook2) or 191 ± 20 pg/mg protein (pHook2/vzg-1). Data are expressed as a percentage of maximal response at 1 μM LPA over control (no LPA), the mean ± SEM (n ≥ 4). LPA at 0.1–10 μM significantly increased CAT expression in pHook2/vzg-1-transfected cells (P < 0.05 vs. no LPA using Student’s t test). Both PTX and his-C3 exoenzyme significantly blocked LPA-induced increase in CAT ex-pression (P < 0.05 vs. no treatment with toxins). (B) Effect of PTX or his-C3 exoenzyme on DNA synthesis stimulated by LPA through VZG-1 expression. The S-3 cells were treated without or with PTX or his-C3 exoenzyme and DNA synthesis assayed after 24 h by a 1-h BrdU pulse. Basal percentages of BrdU-incorporated cells were 19.6 ± 1.9 (no treatment), 22.7 ± 2.0 (PTX), or 24.8 ± 1.6% (his-C3). Data are expressed as a percentage of control (no LPA), mean ± SEM (n = 3–6). ∗, P < 0.05 vs. no LPA. #, P < 0.05 (using Student’s t test) vs. 1 μM LPA in nontreated culture.

