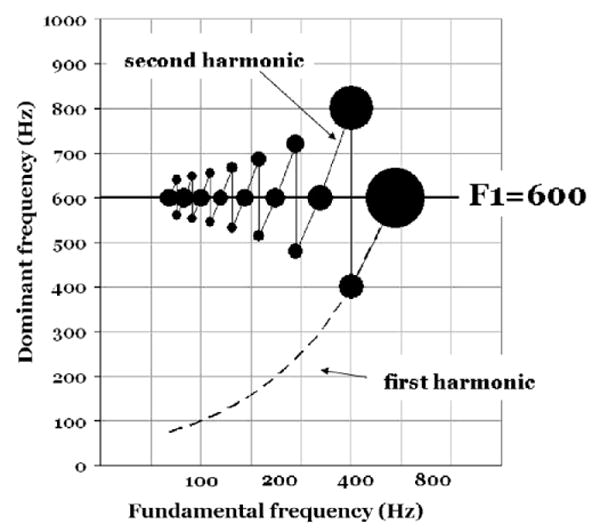
Fig. 6.

This figure shows how the DFs vary as F0 is changed from 75 Hz to 600 Hz in the region around a first formant at 600 Hz. DFs were measured for F0:s where the formant peak coincided with a harmonic and where two harmonics are symmetrically positioned above and below 600 Hz. The areas of the filled circles are proportional to the number channels at the indicated DF frequency.
