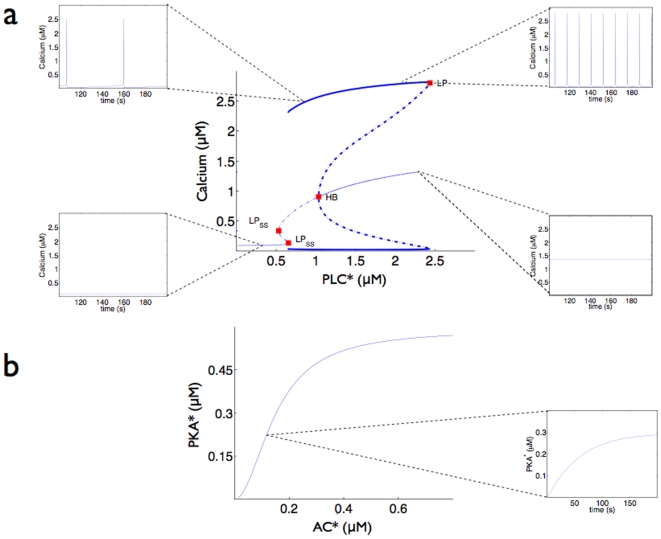
Figure 2. The dynamics of the G pathway (upper panels) and the G
 pathway (lower panels).
a A bifurcation diagram for the G pathway showing the nature of the calcium response for differing concentrations of activated PLC
 . Thin lines indicate a stable steady-state concentration of calcium; thick lines indicate that calcium concentrations oscillate. The upper thick line marks the maximum concentration that calcium reaches during one oscillation; the lower thick line marks the minimum concentration reached. Dotted lines indicate unstable attractors and red squares show bifurcation points. The label HB indicates a Hopf bifurcation; LP indicates a saddle-node bifurcation. The frequency of calcium oscillations ranges from effectively zero Hz when the concentration of PKC
 is near 0.65
  M and to approximately 0.12 Hz (a period of around 8 s) when the concentration of PKC
 is near 2.4
  M. Example time courses of calcium concentration illustrating the appearance and disappearance of oscillations are shown at different points in the bifurcation diagram: at activated PLC
 concentrations of 0.3
  M, 0.9
  M, 2.0
  M, and 2.5
  M. b A bifurcation diagram for the G
 pathway showing stable steady-state concentrations of activated PKA for differing concentrations of activated AC. cAMP concentrations behave similarly and appear linear for the AC concentrations shown. In the example time course at 0.15
  M concentration of activated AC, activated PKA increases monotonically with time while agonists are present. The concentration of cAMP behaves similarly.

