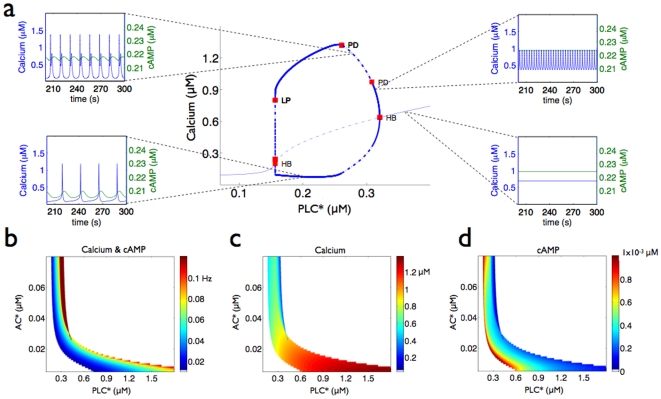
Figure 4. The response of the system with positive or mutually activating interactions between cAMP and calcium.
a A bifurcation diagram for calcium as a function of activated PLC when activated AC is at 0.17
  M. Symbols are the same as Fig. 2. PD indicates a period-doubling bifurcation. Example time courses of calcium and cAMP are shown when activated PLC
 is at 0.2
  M, 0.28
  M, 0.31
  M, and 0.36
  M. Bursting oscillations appear for intermediate activated PLC
 concentrations. The amplitude of the oscillations increases and decreases as activated PLC
 increases, and oscillations gradually disappear. b The frequency of the cAMP and calcium oscillations as a function of both activated AC and PLC
 concentrations. c The amplitude of the calcium oscillations. d The amplitude of the cAMP oscillations.

