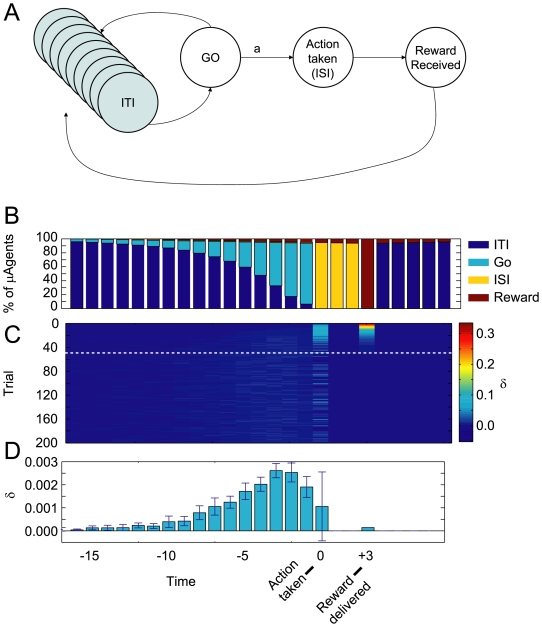
Figure 8. Modeling dopaminergic signals prior to movement.
(A) State space used for simulations. The GO state has the same observation as the ITI states, but from GO an action is available. (B) Due to the expected dwell-time distribution of the ITI state, µAgents begin to transition to the GO state. When enough µAgents have their state-belief in the GO state, they select the action a, which forces a transition to the ISI state. After a fixed dwell time in the ISI state, reward is delivered and µAgents return to the ITI state. (C) As µAgents transition from ITI to GO, they generate δ signals because V(GO)>V(ITI). These probabilistic signals are visible in the time steps immediately preceding the action. Trial number is represented on the y-axis; value learning at the ISI state leads to quick decline of δ at reward. (D) Average δ signal at each time step, averaged across 10 runs, showing pre-movement δ signals. These data are averaged from trials 50–200, illustrated by the white dotted line in C. B, C, and D share the same horizontal time axis. Compare to [56].

