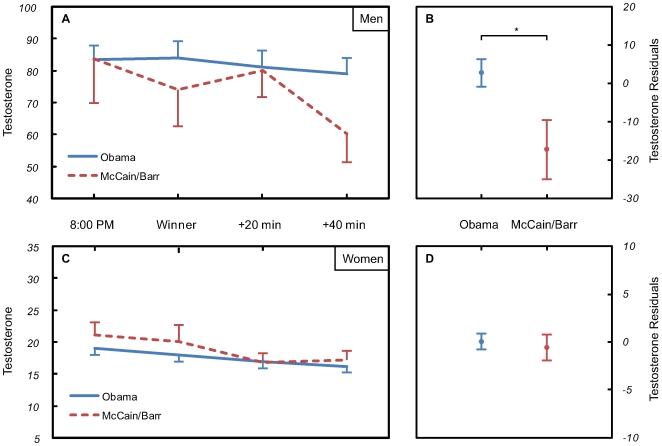
Figure 1. Testosterone changes on election night.
Time-course of salivary testosterone (in pg/mL) in U.S. Presidential election voters on November 4th, 2008. In Panels A & C, times depicted correspond to T1 through T4 as described in the paper. Testosterone residual change scores from T1 to T4 in men (Panel B) and women (Panel D) who voted for the winner (Obama) or the losers (McCain or Barr).

