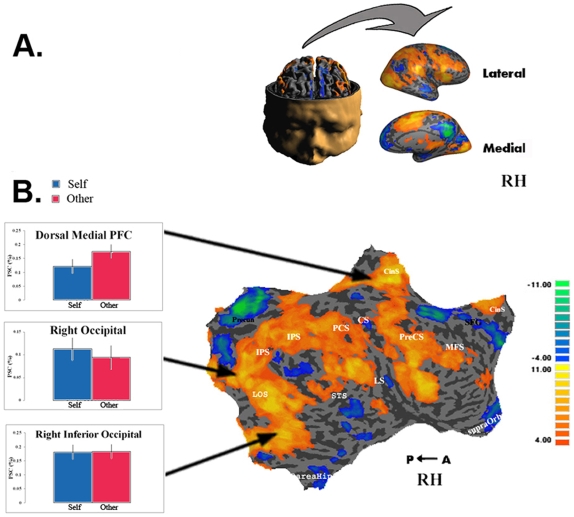
Figure 7. Extrinsic control regions and Self Recognition – Right Hemisphere.
A. Folded and inflated views of RH. B. Conjunction map of all tasks vs. fixation contrast. Multi-subject analysis (N = 11) testing whether at least one contrast activated the region in at least u subjects with FDR <0.05. The intensity represents the minimum number of subjects for whom the region was activated, ranging from at least 4 subjects (orange) to 11 subjects (yellow). Graphs show multi-subject average BOLD activations of ROIs for responded self and for responded other conditions. Extrinsic control regions showed no difference in levels of activation between the responded self and responded other conditions. Error bars represent SEM.

