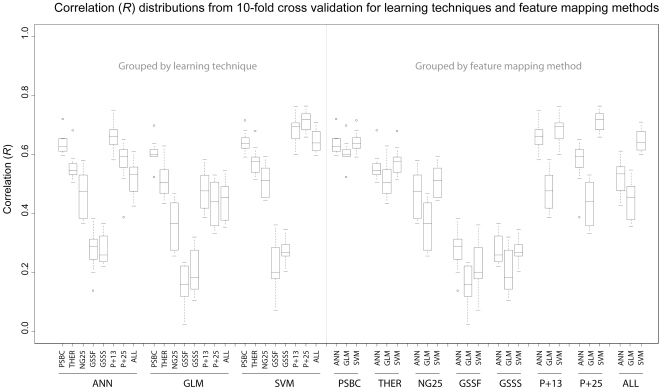
Figure 1. Box-and-whisker diagrams for the cross validation estimates of model precision performance, or Pearson correlation (R).
Boxes encompass the first to third quartile of the distribution. The medians of the distributions are given as horizontal lines within the boxes. Whiskers encompass the 5% to 95% confidence regions of the distribution. Statistical outliers are shown as open circles. The left side of the diagram groups the model precision estimates by machine learning technique. The right side of the diagram groups the model precision estimates by feature mapping method.

