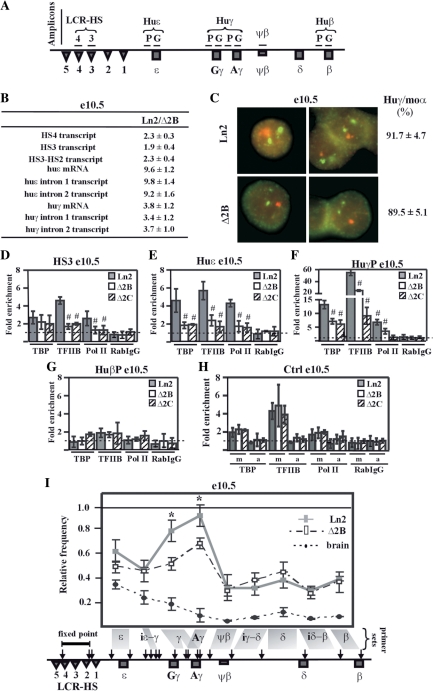
Figure 1.
HS2 deletion affects PIC formation at huγ-promoters and long-range interactions among LCR and huγ-globin genes in e10.5 EryC. (A) Schematic representation of the human β-globin locus. Regions (amplicons) analyzed by ChIP are represented by horizontal lines. Due to high sequence similarity at huγ-promoters and at huγ-genes, the same primer sets amplify both the huAγ- and huGγ-promoters or genes; (B) RNA purified from ln2 and Δ2B e10.5 yolk sacs (e10.5) was retro-transcribed. Transcript quantification was made by qPCR, and relative levels of transcription (Ln2/Δ2B) were calculated according to Pfaffl (52) using mouse actin cDNA as internal control; HS4 or HS3 transcript: HS4 or HS3 primary transcript; HS3-HS2 transcript: primary transcript of the intergenic region between HS3 and HS2; huɛ mRNA: huɛ-globin mRNA transcript; huɛ intron 1 or 2 transcript: ɛ-globin intron 1 or 2 primary transcript; huγ mRNA: huγ-globin mRNA transcript; huγ intron 1 or 2 transcript: γ-globin intron 1 or 2 primary transcript (both Aγ and Gγ transcripts are amplified with the primer sets used); (C) Representative example of RNA–FISH on ln2 and Δ2B e10.5 yolk sacs (e10.5). Green signals: mouse α-globin primary transcript (moα; FITC detection); red signals: huγ-globin primary transcript (huγ; Texas Red detection; both Aγ and Gγ are recognized by the probes); (D–H) ChIP assays were carried out on e10.5 yolk sacs (e10.5; gray bars: ln2; white bars: Δ2B; dashed bars: Δ2C). Immunoprecipitated and input chromatin samples from TBP ChIP were subjected to duplex semiquantitative hot PCR and from TFIIB, Pol II and RabIgG (rabbit IgG) ChIP to qPCR. Fold enrichment (y-axis) of globin regions relative to the control and input samples are represented by bars, with corresponding standard deviations. A value of 1 (dashed line) indicates no enrichment. The positive control for TBP, TFIIB and Pol II ChIP is represented by m (mouse β-globin HS2; mHS2/Thp) and the negative control by a (amy/Thp); hash sign (#): P ≤ 0.05 according to Student's t-test (ln2 versus Δ2B or ln2 versus Δ2C). The regions analyzed are specified on each graph and the antibodies used for ChIP assays are indicated underneath each graph; (I) 3C assay performed on e10.5 yolk sacs (e10.5; gray line: ln2; dashed line: Δ2B). 3C ligation products were used as templates for qPCR analysis of the regions indicated on the x-axis. EcoRI digestion sites are shown by vertical arrows on the locus and fragments of interest are delimited by gray boxes. A primer set is formed by the combination of HS4-HS2 primer (fixed point) and one of the following primers: ɛ: huɛ-gene; iɛ-γ: intergenic region between huɛ- and huγ-gene; γ: huGγ- and huAγ-genes; Aγ: huAγ-gene; ψβ: ψβ gene; iγ-δ: intergenic region between huAγ- and huδ-gene; δ: huδ-gene; iδ-β: intergenic region between huδ- and huβ-gene; β: huβ-gene. Relative cross-linking frequency (y-axis) of the fixed point with globin fragments was defined using naked DNA as control and normalized to mouse actin. A relative frequency of one was attributed to the highest cross-linking frequency; asterisk (*): P ≤ 0.001 according to Student's t-test (ln2 versus Δ2B); e12.5 brain cells (dotted line), in which human β-like globin genes are not expressed were used as control.

