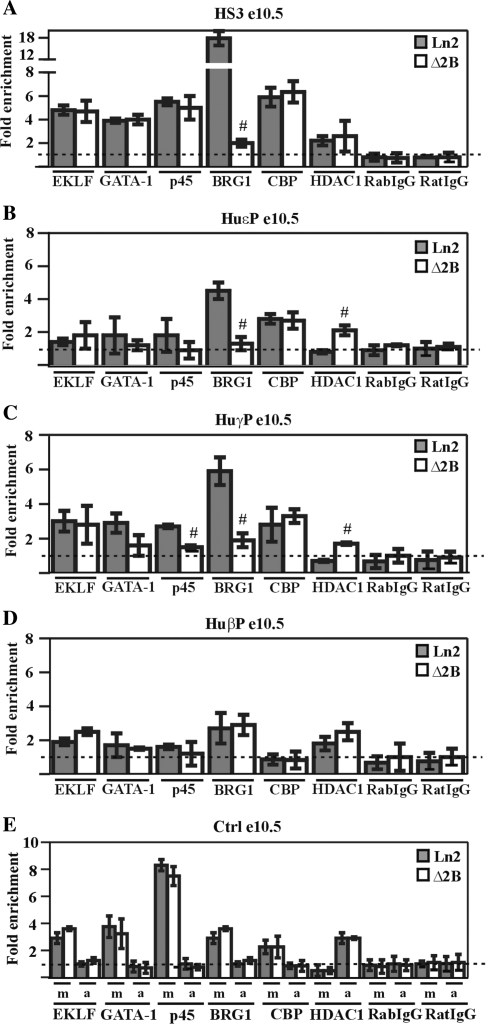
Figure 2.
Transcription factor and co-factor recruitment at the huβ-globin locus in ln2 and Δ2B e10.5 EryC. (A–E) ChIP assays were carried out on e10.5 yolk sacs (e10.5; gray bars: ln2; white bars: Δ2B); immunoprecipitated and input chromatin samples were subject to qPCR. Fold enrichments were calculated as described in Figure 1 and are indicated on the y-axis; the positive control for EKLF, GATA-1, p45, BRG1 and CBP ChIP is represented by m (mHS2/Thp) and for HDAC1 ChIP, by a (amy/Gapdh). The negative control for EKLF, GATA-1, p45, BRG1 and CBP ChIP is represented by a (amy/Thp) and for HDAC1 ChIP, by m (mHS2/Thp). Hash sign (#): P ≤ 0.05 according to Student's t-test (ln2 versus Δ2B). The regions analyzed are specified on each graph and the antibodies used for ChIP assays are indicated underneath each graph.

