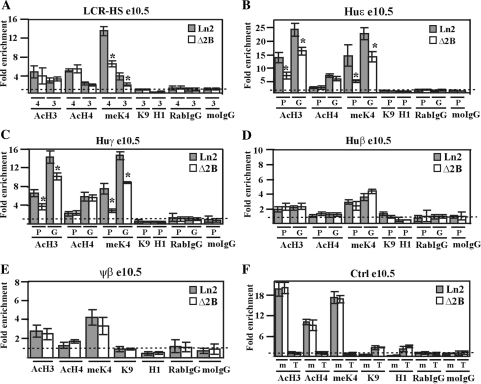
Figure 5.
Effect of HS2 deletion on huβ-globin locus chromatin organization in e10.5 EryC. (A–F) ChIP assays were carried out on e10.5 yolk sacs (e10.5; gray bars: ln2; white bars: Δ2B). Immunoprecipitated and input chromatin samples from AcH3, AcH4 and meK4 ChIP were subjected to duplex quantitative PCR and from meK9, H1, RabIgG and moIgG ChIP were subjected to qPCR. Fold enrichment (y-axis) of globin regions relative to the control and input samples were calculated as described in Figure 1. The negative control for AcH3, AcH4 and meK4 ChIP is represented by T (Thp/Zfp) and for H1 and meK9 ChIP, by m (mHS2/Thp). The positive control for AcH3, AcH4 and meK4 ChIP is represented by m (mHS2/Zfp) and for H1 and meK9 ChIP, by T (Thp/Gapdh); asterisks (*): P ≤ 0.001 according to Student's t-test (ln2 versus Δ2B). The regions analyzed are specified on each graph and the antibodies used for ChIP assays are indicated underneath each graph; 4 (HS4), 3 (HS3), P (promoter), G (gene); AcH3: di-acetylated histone H3; AcH4: tetra-acetylated histone H4; meK4: di-methylated lysine 4 histone H3; H1: Histone H1; meK9: di-methylated lysine 9 and lysine 27 histone H3.

