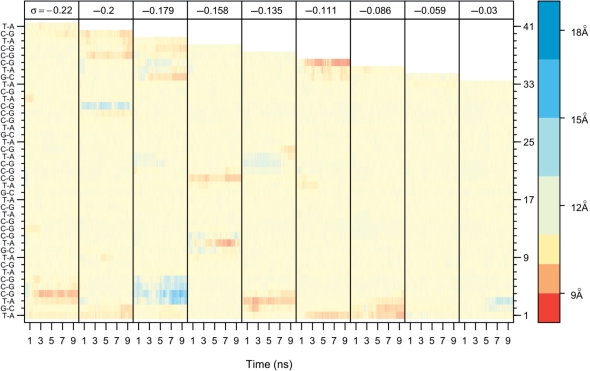
Figure 2.
Sequence-specific base flipping and denaturation as measured by the distance between the sugar oxygens (O4*) over time (total = 10 ns; sampling every 1 ps) and over σ. 11.8 Å (ecru) is the average distance for Watson–Crick base pairs. A distance of 15.6 Å (light blue) indicates that one base has flipped out, and 18.8 Å (dark blue) indicates that both bases have flipped out. In some cases, base pairs have denatured, but have not flipped out, and the twist deficit concentrated at the base pair compresses the distance between backbones (red). The white region at the top of the graph is a consequence of removing bases in order to modulate σ. Base pairs on the left are listed in sequence order starting from the bottom and numbered on the right axis.

