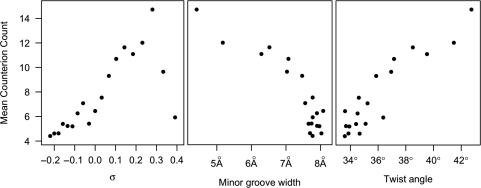
Figure 3.
Mean counterion count correlations with σ, minor groove width and twist angle. Counterions were counted by discretizing the simulation volume into 0.83 Å bins, then, for each time step, minimizing the RMSD of the DNA structure with the structure at the initial time step, and counting the counterion occupancy of each bin. The counterion counts were averaged over the number of base pairs in the helix. The distance across the minor groove between phosphates, the minor groove width, and the twist angle, the average angle of twist for each base pair step in a helix, were determined by 3DNA (31).

