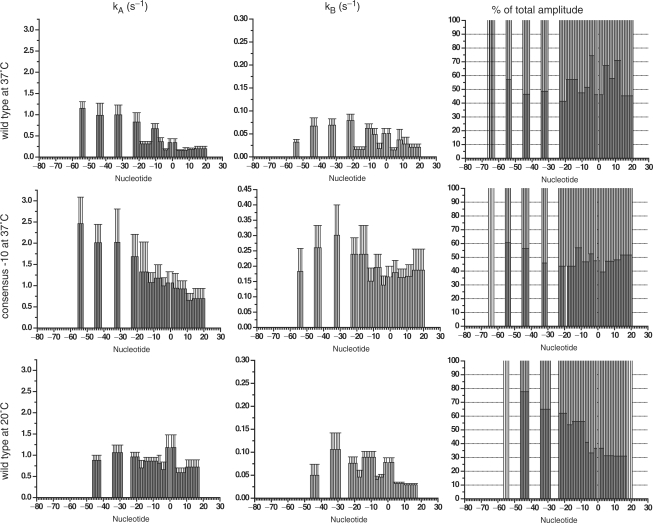
Figure 3.
Summary of the rates and amplitudes for the appearance of protection at each base on the template strand of the promoter region. The data obtained on the wild-type T7A1 promoter at 37°C, on the consensus –10 mutant of the T7A1 promoter at 37°C and on the wild-type T7A1 promoter at 20°C are shown in the first, second and third rows, respectively. The plots in the first column represent the values for the rates within the fast phase of the kinetics, while in the second column the plots represent the values for the rates within the slow phase. The plots in the third column shown the percentage of the amplitude of the two phases for each position on the promoter, in dark grey is the amplitude of the fast phase while in light grey is that of the slow phase.

