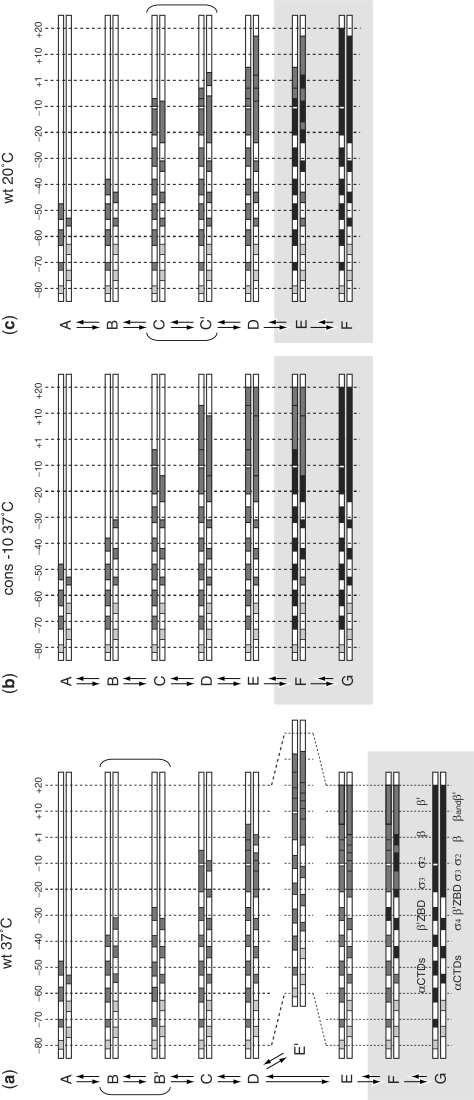
Figure 5.
Protection pattern of each of the intermediates identified by time-resolved X-ray footprinting. The identification of specific intermediates in the pathway was determined from the differences in the rates or in the relative amplitudes of the fast and slow phases of appearance of protection as a function of the position on the promoter. (a) Wild-type T7A1 promoter at 37°C. (b) Consensus –10 mutant of the T7A1 promoter at 37°C. (c) Wild-type T7A1 promoter at 20°C. Light grey boxes correspond to regions with weak protection; grey boxes correspond to the appearance of protection during the first, fast phase; black boxes correspond to the regions which further become protected in the slow phase of the kinetics. The RNAP domains interacting with specific promoter regions are shown for the final complex on the wt promoter. The complexes formed within the slow phase are within the light grey background.

