Figure 8.

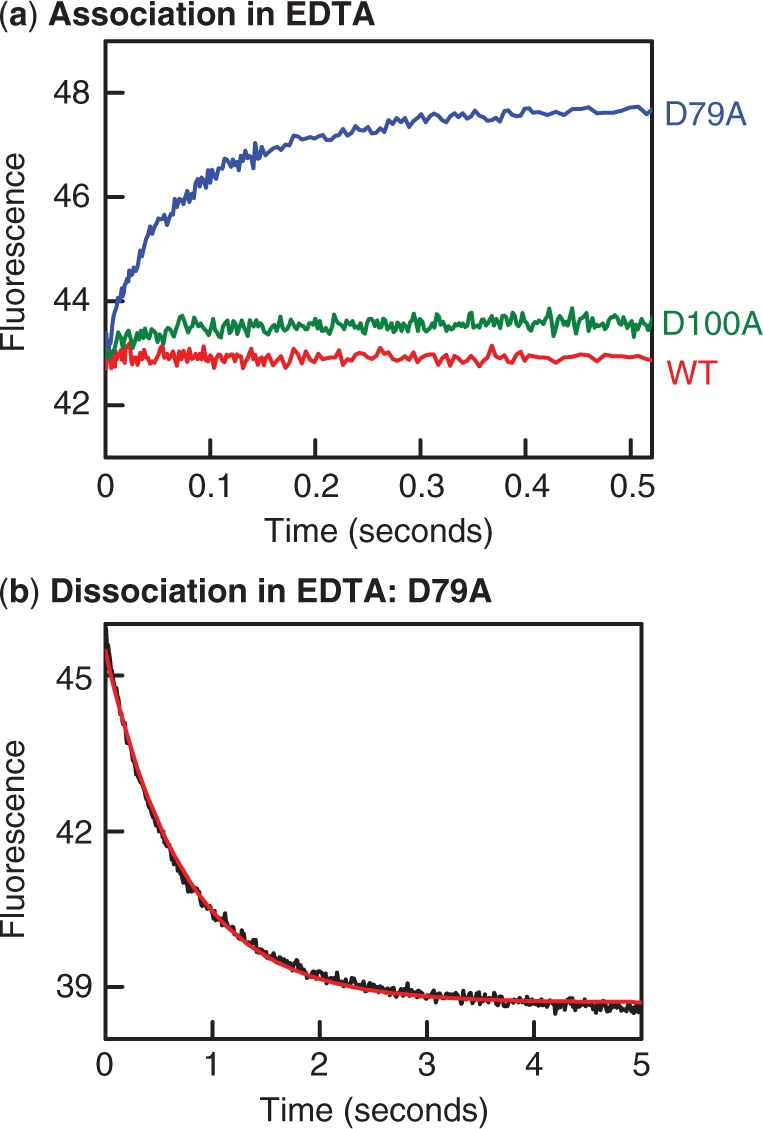
Binding and dissociation in EDTA. (a) Reactions to examine the binding of SfiI to DNA were carried out by mixing in the stopped flow fluorimeter equal volumes of Alexa-21 and SfiI protein, to give reactions at 25°C that contained 50 nM Alexa-21 and 25 nM protein in EDTA fluorescence buffer. The changes in fluorescence observed during the reactions with each protein are shown as follows: wt SfiI, red trace; D100A, green trace; D79A, blue trace. (b) The dissociation of DNA from the D79A protein was examined by mixing in the stopped flow fluorimeter one solution of Alexa-21 and D79A in EDTA fluorescence buffer with an equal volume of C-21 (also in EDTA fluorescence buffer), to give a reaction at 25°C that contained 25 nM D79A, 50 nM Alexa-21 (initially bound to the protein) and 500 nM C-21. The change in fluorescence was monitored: the red line indicates the best fit to a single exponential, to give a rate constant of 1.35(±0.01)s−1. In (a) and (b), fluorescence intensities are cited in arbitrary units.
