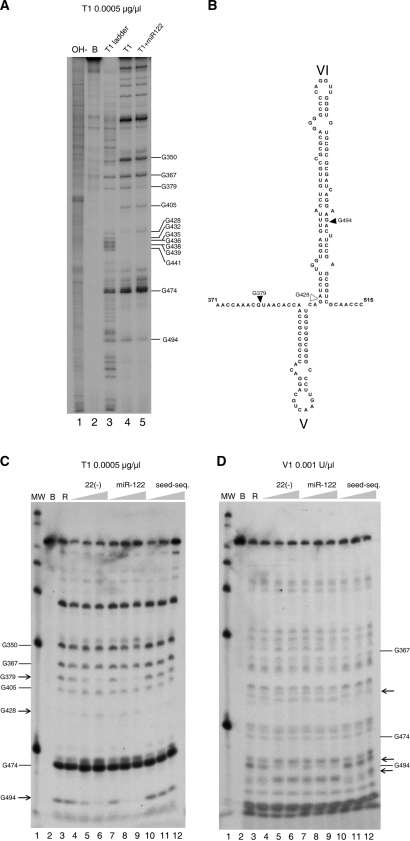
Figure 7.
(A) ‘G’ sequence determination of 3′ end-labeled 1–570 RNA in our standard conditions of cleavage by parallel running of RNA degradation with RNase T1 0.0005 µg/µl in denaturing conditions (lane 3), in standard buffer (lane 4) and in the presence of miR-122 at 15 nM (lane 5). Lanes 1 is an alkali ladder degradation and lane 2, the RNA incubated in standard buffer alone. Gs are identified at the right of the gel. (B) Secondary structure of stem loop VI and its boundary regions summarizing the position with differential reactivity for RNase T1. Increased resistance is indicated by solid triangles and increased sensitivity by blank triangles. Nucleotide numbering is used, as in Figure 1. (C) Evaluation of the effect of increasing concentrations of probes on the T1 nuclease pattern of cleavage. Lane 1 is a MW marker. Control incubation of 1–570 RNA in the buffer (lane 2), or after addition 0.0005 µg/µl of RNase T1 (lane 3). In subsequent lanes, before addition of the T1 RNase, RNAs were pre-incubated for 1 h with increasing concentrations of ODN 22(−) of 15 nM, 150 nM and 1500 nM (lanes 4–6), or miR-122 at final concentrations of 1.5 nM, 15 nM and 150 nM (lanes 7–9) and a 10-mer oligoribonucleotide carrying the 7 nucleotides of the miR-122 seed sequence to a final concentration of 1.5 nM, 15 nM and 150 nM (lanes 10–12). (D) Same as panel B, but the RNase used was double-stranded RNase V1. Arrows indicate the changes in sensitivity to the nuclease.

