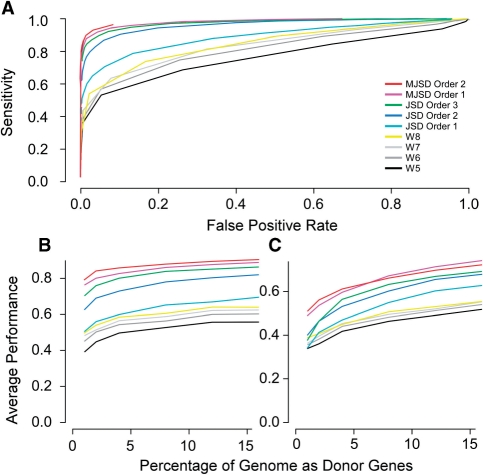
Figure 2.
ROC curves for MJSD, JSD and Wn methods for detecting atypical genes. (A) Detecting atypical genes in an artificial E. coli genome with 16% donor genes. (B) Detection of the N% highest atypicality values in an artificial E. coli core. (C). Detection of the N% highest atypicality values in a genuine E. coli core, where N denotes the percent donor genes.

