Figure 6.
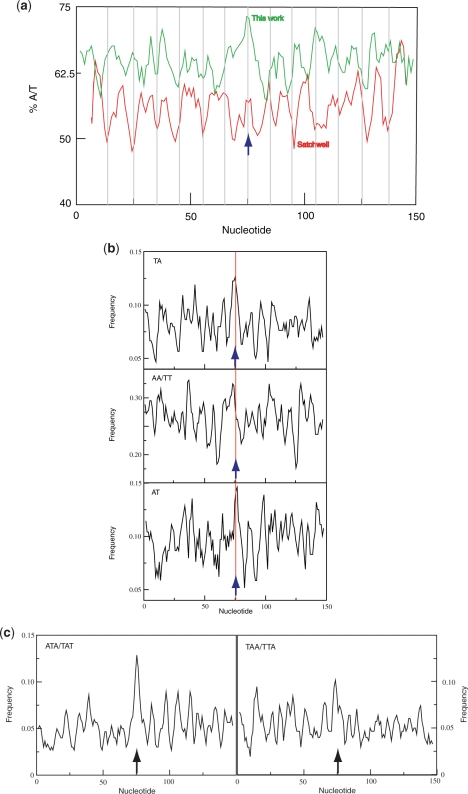
(a) Average base composition of collated set of DNA sequences mapped by partial MNase digestion (green line) compared with the set of chicken erythrocyte (7) (red line). Bars are placed at 10-bp intervals from the dyad. The chicken erythrocyte plot reveals minima at or close to many of the bars consistent with the conclusion that A/T containing dinucleotides occur at a lower frequency where the DNA minor groove points away from the surface of the histone octamer. The lower average A/T content of the chicken erythrocyte nucleosomal DNA reflects the lower A/T content (∼57%) of chicken DNA relative to yeast DNA (∼62%). (b) Frequency of occurrence of TpA and ApA/TpT dinucleotides in collated set of nucleosome positions mapped by partial MNase digestion. (c) Frequency of occurrence of TAT/ATA and TAA/TTA trinucleotides. Sequence midpoints are arrowed in all panels. In all panels the distribution of nucleotides was calculated using a 3-bp scanning window.

