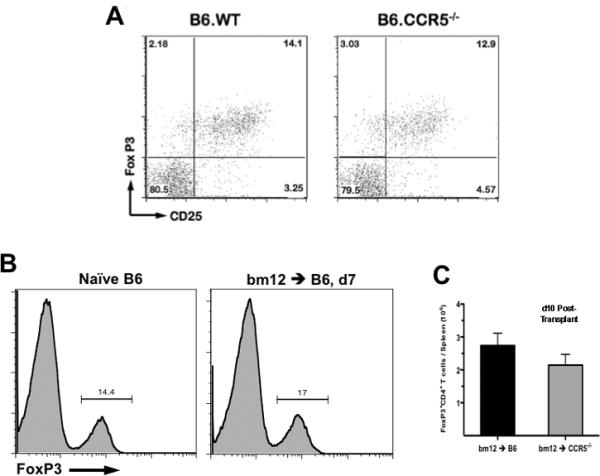
Figure 3. CCR5 -/- and wild-type mice have equivalent numbers of splenic FoxP3 Tregs before and after transplant.

A. Naïve wild-type B6 or B6.CCR5-/-spleens were harvested and CD4 T cells expressing FoxP3 and CD25 expression were identified by flow cytometry. Numbers in each quadrant represent percentage of total CD4+ events. Plots shown are representative of 5 animals per group. B. Spleens were harvested from naïve wild-type B6 mice or from wild-type B6 recipients of bm12 heart allografts on day 7 post-transplant. Lymphocytes were processed for flow cytometry and were stained for CD4 and FoxP3 expression. Histograms shown represent FoxP3 expression on total CD4+ T cells; the numbers represent percentage of FoxP3+ cells and are representative of 3 mice per group. C. Whole spleens were harvested from wild-type or CCR5-/- recipients of bm12 heart allografts on day 10 post-transplant. The total number of lymphocytes per spleen was enumerated and samples were processed for flow cytometry. In each sample, the percent of total lymphocytes that were CD4+FoxP3+ was determined and then multiplied by the total number of lymphocytes per spleen to quantify the total number of Tregs per spleen. Data represents mean ± SEM, n=5/group, p > 0.05.
