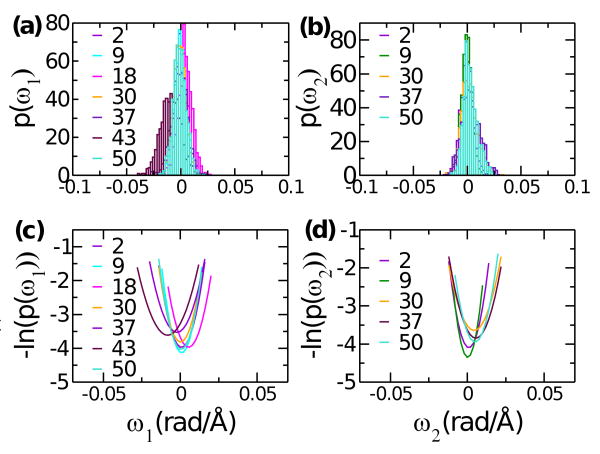
Fig. 2.
Example distributions of (a) ω1 and (b) ω2, and (c,d) quadratic fits to their logarithm. Corresponding triad numbers are marked in the graph. While equilibrium curvatures ω01 & ω02 are generally 0 along the length of tropomyosin, at triad 43 (lowest rigidity region Fig. 4(b)) ω01 is about −0.01.

