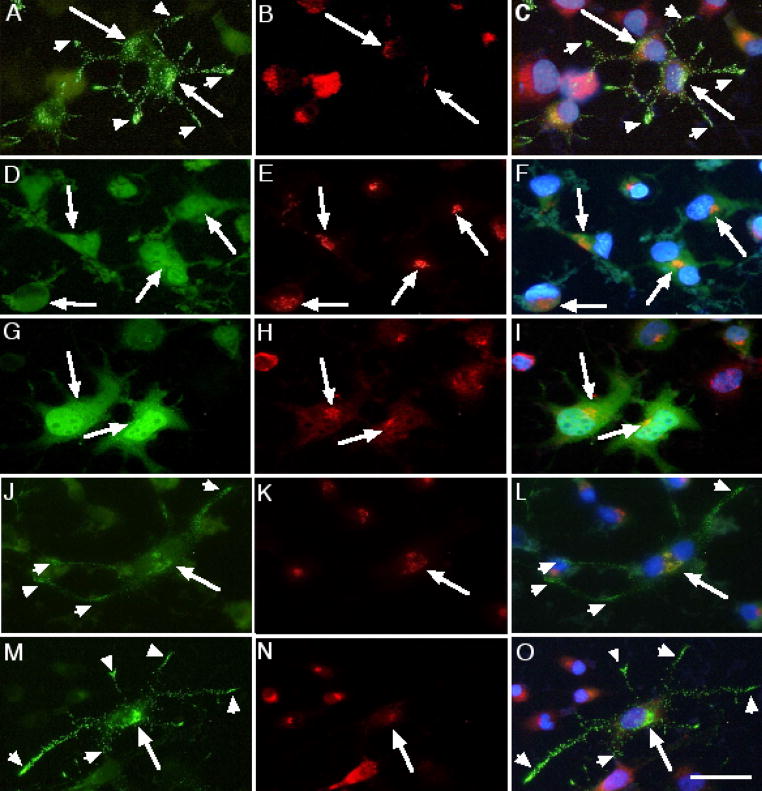
Figure 2.
Co-localization of the different GFP-fusion constructs expressed in Neuro-2a cells in neurites and Golgi. Green is GFP, Red is Texas Red staining for Golgi (α-mannosidase II) and Blue (Hoechst) indicates nuclear DNA. Arrowheads indicate punctate granules in the neurites. Arrows indicate areas of overlap (Yellow). (A, B &C) VP-GFP; (D, E & F) SP-GFP; (G, H & I) AVP-GFP; (J, K & L) NP-GFP; AN-GFP (M, N & O). Bar= 10 micrometers.

