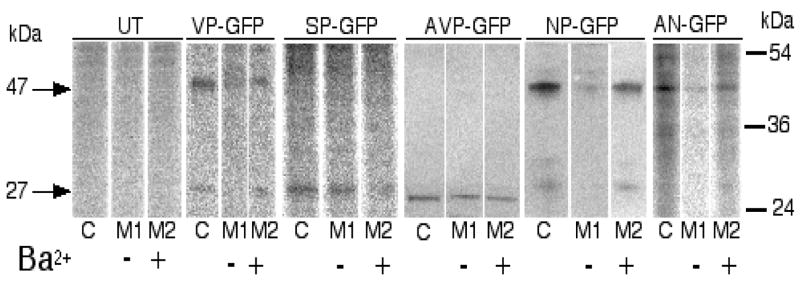
Figure 5.
Secretion of GFP-fusion proteins from Neuro-2a cells in response to BaCl2 stimulation. [35S]labeled proteins were immunoprecipitated with antibodies to GFP and separated on SDS-PAGE, the gels imaged on a Fuji-FLA-2000 phosphorimager and identified by size. The arrows on the left (27 and 47) indicate the approximate size of the two major bands observed in the images. The bars on the right represent the three Benchmark® (Gibco) standards (kDa) in the range shown. The figure is representative of 3 different experiments. In the table at the bottom, the densities of the bands scanned on the phosphorimager were averaged and used in the equation at the bottom of the figure. The relative secretion represents the mean ± SEM from the three independent experiments.

