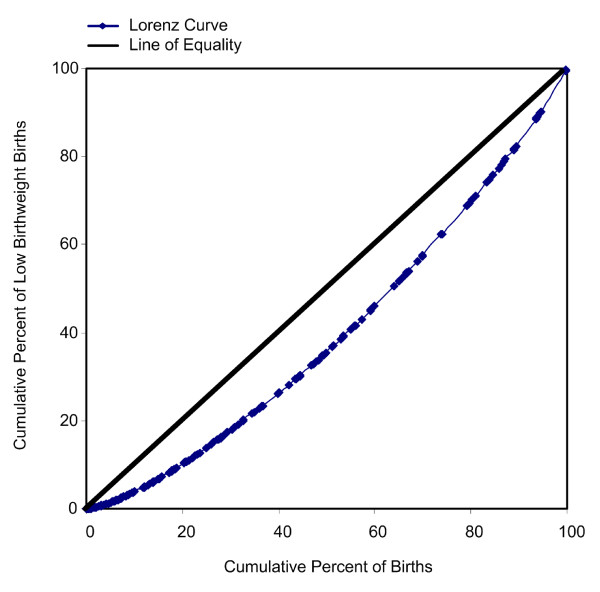
Figure 2.
A Lorenz Curve diagram depicting the distribution of low birthweight births against that of births. Towns are first rank ordered by their percent low birthweight. For each town, the cumulative percent of low birthweight births and the cumulative percent of births are plotted as coordinates to form the Lorenz Curve. The deviation of the Lorenz Curve from the line of equality denotes a concentration of low birthweight births within the larger population of births.

