Figure 4.
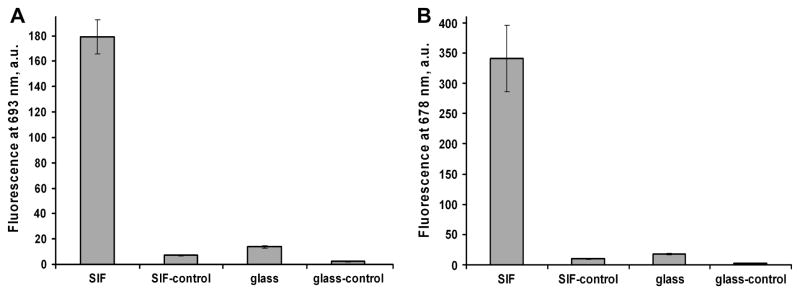
Figure 4A. Fluorescence signals for the model immunoassay using Seta670-IgG4-670 on the SIF/coated and non-coated glass surface: controls are measured using “wrong” antigen (goat IgG) and show the level of non-specific binding. Error bars represent plus/minus one standard deviation (SD) (n=6 for samples and n=4 for controls).
Figure 4B. Fluorescence signals for the model immunoassay using Seta-635 label on the SIF/coated and non-coated glass surface: controls are measured using “wrong” antigen (goat IgG) and show the level of non-specific binding. Error bars represent plus/minus one standard deviation (SD) (n=6 for samples and n=4 for controls).

