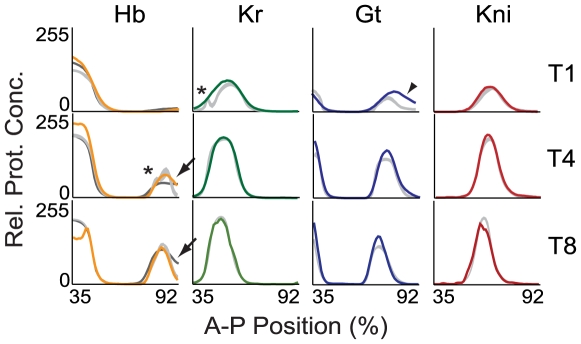
Figure 3. Model output compared to quantitative expression data.
Integrated expression profiles from the FlyEx data base [14],[15] are shown for Hb (yellow), Kr (green), Gt (blue) and Kni (red; left to right) for time classes T2, T5 and T8 (top to bottom). Light grey profiles show corresponding profiles based on numerical solution of the current 4-gene model with parameter estimates obtained by WLS fits (see main text). The dark grey profile for Hb (left) shows model output of a representative 6-gene model from 7. Arrows highlight the correct establishment and anterior shift of the posterior boundary of the posterior hb domain. Patterning defects in the model are indicated as follows: Asterisks indicate bulges in the anterior borders of the central Kr and the posterior hb domain; arrowhead indicates slightly incorrect position of the early posterior border of the posterior gt domain. We emphasise discrepancies in boundary shape and position over those in expression levels since the latter are somewhat arbitrary due to the relative protein concentrations in the data. The incorrect reproduction of the late-appearing ‘dip’ in the anterior hb domain is expected, as the model currently does not include separate phases of early and late hb regulation (see [1] for details). Plot axes as in Figure 2, middle and right column.

