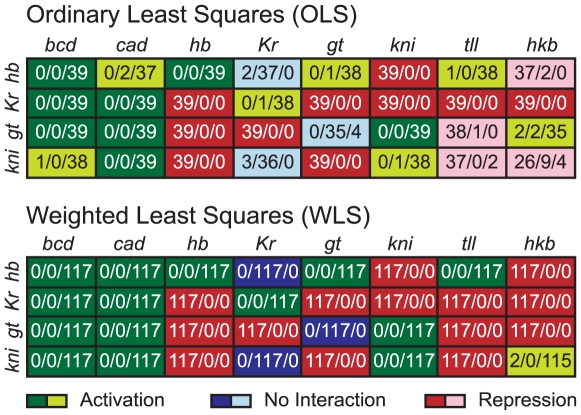
Figure 4. Predicted regulatory network topologies from models obtained by OLS and WLS fits.
The distribution of regulatory weights for each regulator (columns) and regulated gene (rows), is shown for OLS fits (above) and WLS fits (below). Number triplets show how many parameter estimates (from independently obtained optimisation solutions) fall into the regulatory categories of ‘repression’ (parameter values  ; left), ‘no interaction’ (between
  and
and  ; middle), and ‘activation’ (parameter values
  ; right). Background colours indicate whether a majority of the weights for a particular interaction show repression (red), activation (green) or no interaction (blue). Dark background means that all solutions fall into the same category; light colours indicate ambiguity in the prediction where some solutions fall into a different category than others. Note that the regulatory topology predicted by WLS fits with fixed Hkb weights (WLSfh) is exactly the same as that for WLS fits (not shown).

