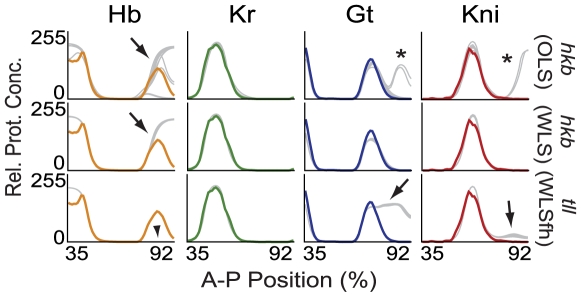
Figure 7. Simulation of terminal gap gene mutants.
Simulated expression profiles of Hb, Kr, Gt and Kni (left to right) in hkb (top: OLS, middle: WLS) and tll mutant backgrounds (bottom: WLS with fixed Hkb weights) are shown at time class T8. Plot axes and colours as in Figure 3: wild-type data shown in colour, mutant model output in grey. Arrows indicate de-repression of posterior gap gene expression, arrowhead absence of the posterior hb domain; both consistent with experimental evidence. Asterisks indicate posterior de-repression of gt and kni in OLS circuits inconsistent with published experimental observations.

