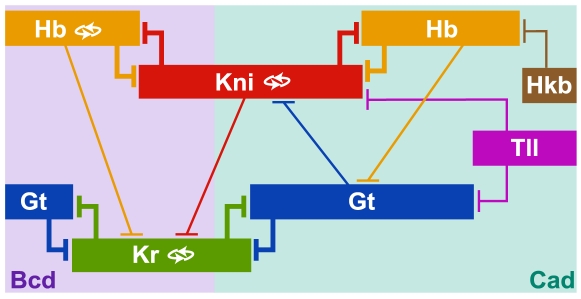
Figure 8. Summary of predicted gap gene regulatory mechanisms.
Gap domains are shown schematically, with anterior to the left, posterior to the right. Background colours indicate the most prominent activating input to each domain. Auto-activation is indicated by double-arrows. T-bars indicate repressive gap-gap cross-regulation (thickness of the bars indicates repressive strength). See text for details.

