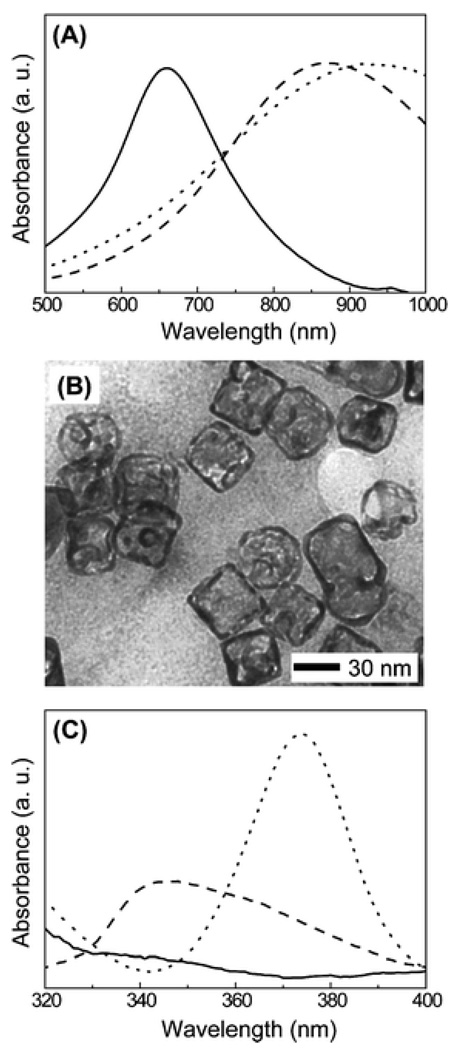
Fig. 3.
(A) UV-Vis spectra of 1 nM Au–Ag nanocages (solid line), after reacting with 1 mM mPEG-SH aqueous solution (dashed line), and after reacting with 0.1 mM mPEG-SH and then 1 mM HS(CH2)2OH (dotted line). (B) TEM micrographs after reacting with 0.1 mM mPEG-SH and then 1 mM HS (CH2)2OH. (C) Absorption spectra in the UV for 1 nM Au–Ag nanocages (solid line) after reacting with 1 mM mPEG-SH aqueous solution (dashed line), and after reacting with 0.1 mM mPEG-SH and then 1 mM HS (CH2)2OH (dotted line). All the reaction times were 24 h.

